Records For Living Community

Share Information about HealthFrame and taking control of your own healthcare
Welcome to Records For Living Community Sign in | Join | Help
in Search

BMI Graph - Question

Last post 05-11-2007, 1:21 PM by Records For Living Support. 5 replies.
Sort Posts: Previous Next
  •  05-10-2007, 4:39 PM 704

    BMI Graph - Question

    Hi to support.

    I am evaluating your program “health frame” and I have a question.

    I am looking at the graph for weight and I see that when I add the bmi to the graph it shows the axis on the left but no data in the graph. I have entered the data in the vital signs tests. Height and weight. I saw the bmi data in the graph once but it has disappeared again. Is this a known bug?

    Best regards

  •  05-10-2007, 4:42 PM 705 in reply to 704

    Re: BMI Graph - Question

    Attachment: bmi.JPG

    Hi, Mike!

    Thanks for sending us this question.  We work hard towards making HealthFrame as intuitive to use as we can.  It is extremely important for us to get feedback from our customers, so that we can continue to improve HealthFrame.

    As you probably know, BMI is calculated as a function of a person's weight and height.  HealthFrame needs both of those pieces of information to figure out your BMI.

    When you ask HealthFrame to graph your weight and BMI, for every weight measurement, HealthFrame locates and uses the most recent height measurement that precedes or coincides with the weight measurement.  If you have no such height measurement, no BMI value is displayed.

    It is important to note that this logic is applied within the constraints of the date range you have chosen for your graph.  (This is probably the issue you're seeing.)  In other words, let's say you entered your height and dated that measurement as of the beginning of the year.  Then let's say you weigh yourself every week and because you want to see how your weight's doing for the past couple of months, you narrow the date range in the graph to start two months ago.  Since the height measurement date is beyond two months, the graph does not 'see' the height measuremend and as a result you don't see the BMI graph.  A way to 'fix' this with the current release is to make sure that the beginning of your graphed date range always contains a height measurement...

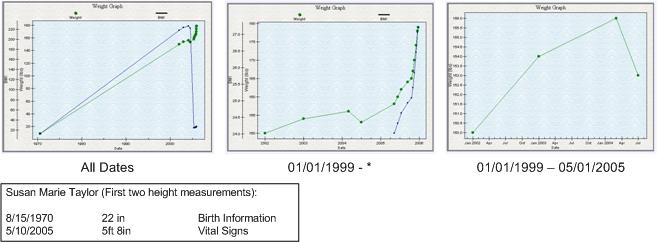
    The images below illustrate this behavior for the Susan Marie Taylor sample.  The first image shows what her weight and BMI look like over different time ranges:

    1. The first date range (all dates) uses her birth "height" until she enters an updated height on 05/10/2005 - note the sharp decline in her BMI once she udpates her height.
    2. The second date range (a little before and a little after she updates her height) includes a section of the graph without the BMI being shown and then the BMI graph shows up.
    3. The third date range does not show any BMI graph at all, since it contains no height measurement (the date range is selected to be between the two first height measurements).

    We understand how this behavior can be confusing and we hope to generate some discussion in the forum around how we can improve on the user experience.

    Thanks again for bringing this to our attention.  We look forward to your suggestions.

    Support Team

  •  05-11-2007, 11:38 AM 706 in reply to 705

    Re: BMI Graph - Question

    (Support Team is posting this reply on behalf of Mike who emailed his response)

    Thanks for your reply.


    I have read your reply on the discussion forum and I tried to reply but the page to make the reply could not be served by your server, even though I was logged in, hence this email.


    I have entered only 3 vital signs tests:


    10/05/2007 185 cm 81kg


    24/04/2007 185cm 83kg


    16/04/2007 185cm 88kg


    So my data range is from the 16/04/2007 to the 10/05/2007. Only three entries all inc height and weight.


    Still the axis shows on the left but even trying every date range the bmi data does not show up in the graph.


    Thanks

    Mike

  •  05-11-2007, 11:46 AM 707 in reply to 706

    Re: BMI Graph - Question

    Attachment: overlapInGraph.JPG

    Mike,

    First of all, we're sorry for the problems you experienced accessing our community forum.  If/when that happens and you find yourself wanting to contact support, please do as you did and email us.  We'll handle the upload of the message.  Unfortunately, we've had some problems with the software we use to host our user community forum and we will likely update the site - though it is a considerable effort and needs to be coordinated so as to minimize the site's downtime.

    Thank you for the additional information.  As you can see, I have entered the data points you provided and reproduced the problem you are seeing.  In fact, we've had a similar discussion in this forum, when Robert pointed out that when three data points are laid out, the graphing software tends to overlay the two graphs: http://community.recordsforliving.com/forums/thread/591.aspx 

    If you look carefully, you'll note the graph points and the line are in two different colors - yes, it's simply too subtle a distinction... We apologize.  The problem should go away as you enter more data, of course.

    We're sorry for this inconvenience and we'll continue to work on improving the graphing layout.

    Thanks,
    Support Team


  •  05-11-2007, 12:14 PM 708 in reply to 707

    Re: BMI Graph - Question

    Great, thanks for that. It works now, although not by adding a 4th test but by adding a fifth! Strange one!

    Wow... and I'm able to reply to threads. You're getting good :-)

    Two more questions:

    1) Is it possible to draw on the graph? For example lines for targets?? This would be real cool and very helpful.

    2) Is it posible to add a test that is not in the list so that it can be selected from the test list in future, rather than having to type it out every time I add the test?

    Thank you.

  •  05-11-2007, 1:21 PM 711 in reply to 708

    Re: BMI Graph - Question

    Attachment: targetweight.JPG

    We're glad to hear that we're "getting good"!  :-)

    1. Adding support for targets is something we've been discussing.  What you can do today is to create a measurement for your targets.  Please look at the image below and take the following steps (for example, "Target Weight"):

    a. For every Vital Signs test entry, click on the Add New measurement button and enter "Target Weight", the target value and the target unit.

    b. When you want to graph, use the user-defined graph and select the measurement you tracked together with the target measurement.

    The image below shows the three data points you had earlier, contrasted with a target weight of 75 kg.

    Having a clearer support for targets, will definitely be 'cool'!  :-)

    2.We've had a number of discussions in the forum about allowing for user-defined measurement and test panels (http://community.recordsforliving.com/forums/thread/403.aspx and http://community.recordsforliving.com/forums/post/685.aspx).  This is definitelly something we'll work to improve in future releases.

    Thanks again for your feedback!

    Support Team


View as RSS news feed in XML
Powered by Community Server, by Telligent Systems