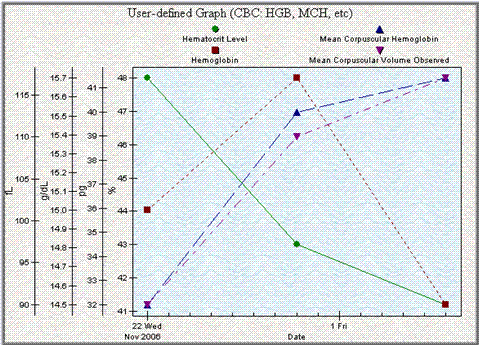
Here are the steps to do what you want with HealthFrame:
1. Enter your wife's CBC lab results
2. Click on Reports > User-defined Graph
3. Click on the context bar at the top of the User-defined Graph, on the ellipsis button (...) - also known as the 'customization button'. Click on the Measurement Type menu item and select as many measurement types as you'd like.
4. When you're happy with the graph you've defined, click again on the ellipsis button and this time select the Save Customization As... menu item. You'll be prompted to enter the name you wish for this new graph you have created (e.g. CBC: Red and White Cells).
5. If you create many graphs, you'll periodically wish to switch from one to another. You can do that by either going to the Reports > Graphs section or by going to the User-defined Graph and clicking on the customization button, and this time using the Select Customization menu item.
For more information, please read the help files on "Customizations" and Reports/User-defined Graphs.
Please let us know if we can be of further help.
Thanks,
Support Team
