Thank you for your follow-up, JaneAnn. We're very happy to hear that you are pleased with our level of support.
![Big Smile [:D]](/emoticons/emotion-2.gif)
We agree that making it easier to create graphs from within HealthFrame makes it more exciting for users to track their health progress. This is something we will be working to improve in future releases.
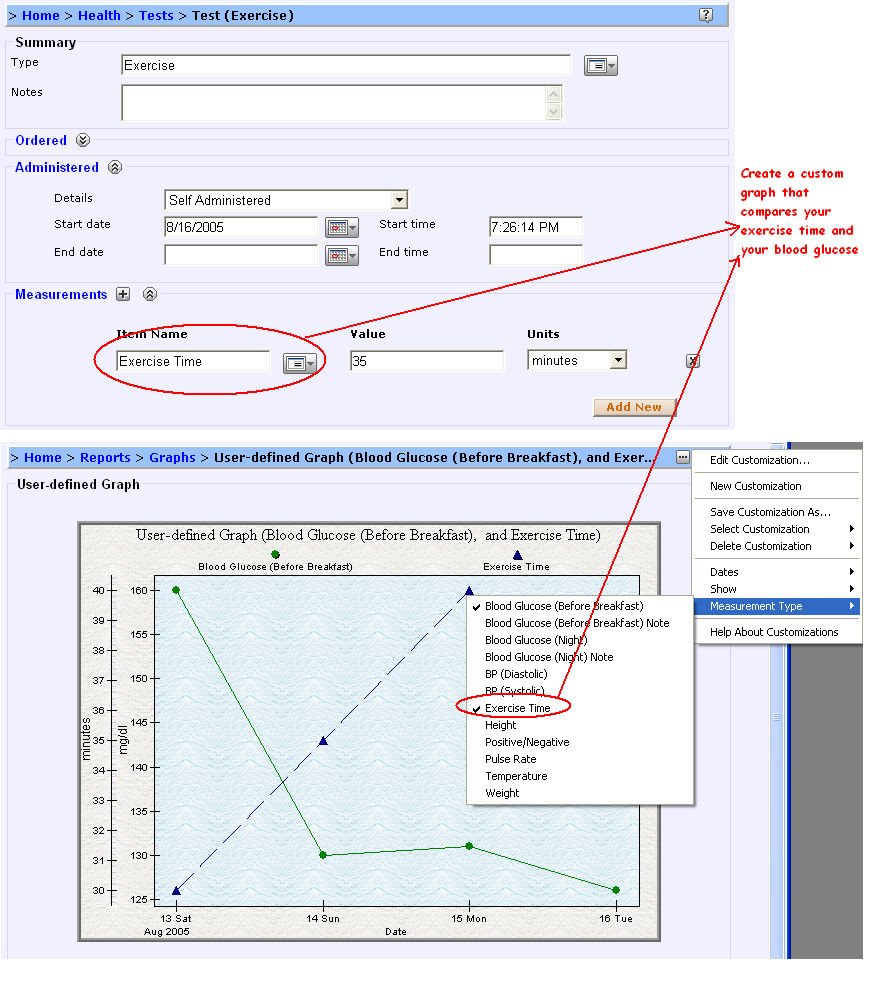
As for knowing "how much my exercise time affects my glucose test results", you can actually do THAT with the current version... Here's what you can do: track your glucose test results as you normally would (i.e. either by entering a single test measurement or by using the "Blood Glucose Daily Measurements" panel. Then track as a separate 'test' the amount of time you exercise daily. Then you can create a user-defined graph that shows your exercise time AND your blood glucose measurements in the same graph.
We hope you find this useful and thank you again for your feedback,
Support Team