Finally, as far as its support for
graphing data, HealthFrame comes with a number of built-in graphs, as well as the ability to create user-defined graphs for single or multiple overlaid test results.
Built-in graphs include:
- Blood glucose graph
- Blood lipids graph
- Blood pressure graph
- Growth chart (for children)
- Weight graph
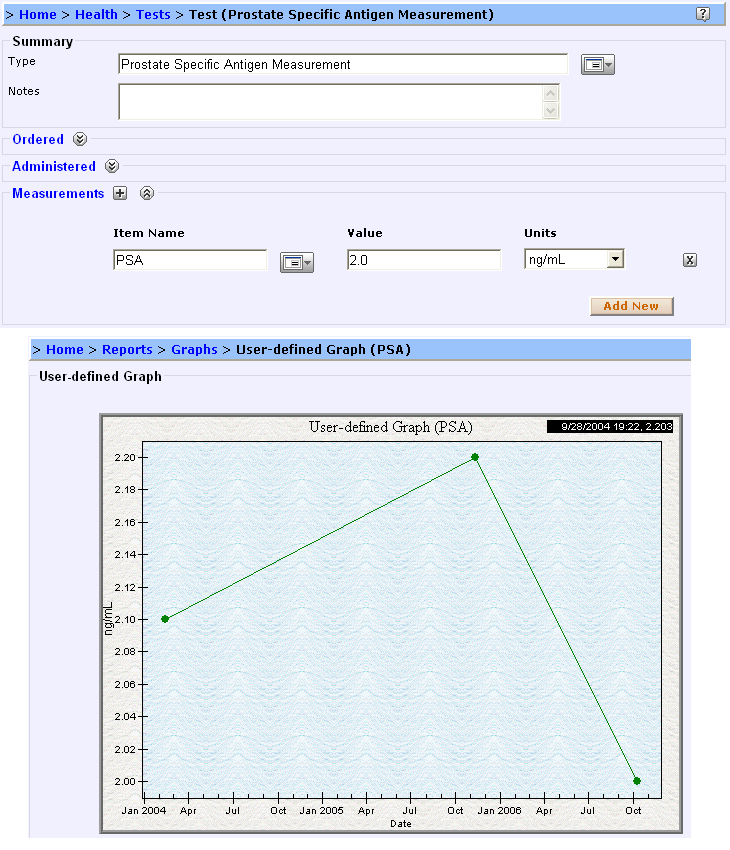
The image below illustrate how you can enter PSA test results and later graph them.
Please let us know if we can be of further assistance,
Support Team