Dan,
Thank you for the suggestion. We have built-in a lot of information into HealthFrame that will be used in future versions as part of improved 'filtering' support in reports, graphs, etc.
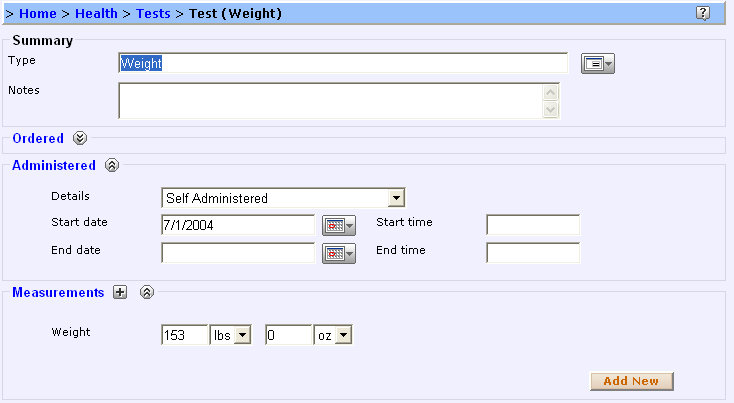
For instance, when you self-administer any test (weight, blood pressure, blood glucose, etc) HealthFrame tracks that information (see test entry below). Future releases will be able to create different graphs for instance, for all blood pressure measurements vs. vital signs taken at Doctor's office vs. self-administered blood pressure measurements.
For the time being, as a work-around, you can try and label one of those types of tests differently and then use the user-defined graphs to chart the results.
Thanks for the suggestions!
Support Team
