Mike,
First of all, we're sorry for the problems you experienced accessing our community forum. If/when that happens and you find yourself wanting to contact support, please do as you did and email us. We'll handle the upload of the message. Unfortunately, we've had some problems with the software we use to host our user community forum and we will likely update the site - though it is a considerable effort and needs to be coordinated so as to minimize the site's downtime.
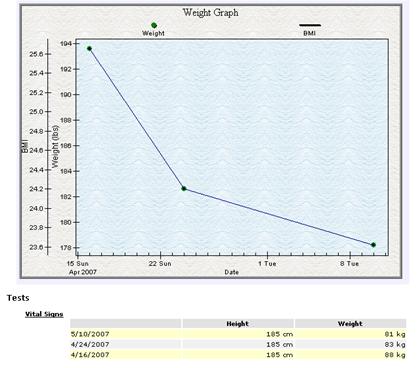
Thank you for the additional information. As you can see, I have entered the data points you provided and reproduced the problem you are seeing. In fact, we've had a similar discussion in this forum, when Robert pointed out that when three data points are laid out, the graphing software tends to overlay the two graphs: http://community.recordsforliving.com/forums/thread/591.aspx
If you look carefully, you'll note the graph points and the line are in two different colors - yes, it's simply too subtle a distinction... We apologize. The problem should go away as you enter more data, of course.
We're sorry for this inconvenience and we'll continue to work on improving the graphing layout.
Thanks,
Support Team