Hi, Mike!
Thanks for sending us this question. We work hard towards making HealthFrame as intuitive to use as we can. It is extremely important for us to get feedback from our customers, so that we can continue to improve HealthFrame.
As you probably know, BMI is calculated as a function of a person's weight and height. HealthFrame needs both of those pieces of information to figure out your BMI.
When you ask HealthFrame to graph your weight and BMI, for every weight measurement, HealthFrame locates and uses the most recent height measurement that precedes or coincides with the weight measurement. If you have no such height measurement, no BMI value is displayed.
It is important to note that this logic is applied within the constraints of the date range you have chosen for your graph. (This is probably the issue you're seeing.) In other words, let's say you entered your height and dated that measurement as of the beginning of the year. Then let's say you weigh yourself every week and because you want to see how your weight's doing for the past couple of months, you narrow the date range in the graph to start two months ago. Since the height measurement date is beyond two months, the graph does not 'see' the height measuremend and as a result you don't see the BMI graph. A way to 'fix' this with the current release is to make sure that the beginning of your graphed date range always contains a height measurement...
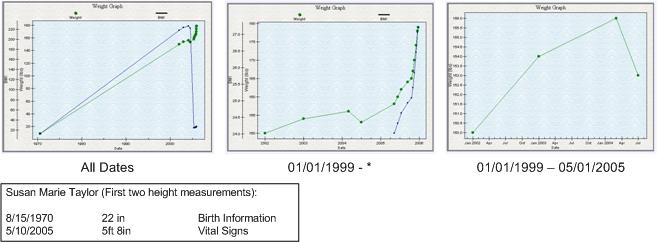
The images below illustrate this behavior for the Susan Marie Taylor sample. The first image shows what her weight and BMI look like over different time ranges:
- The first date range (all dates) uses her birth "height" until she enters an updated height on 05/10/2005 - note the sharp decline in her BMI once she udpates her height.
- The second date range (a little before and a little after she updates her height) includes a section of the graph without the BMI being shown and then the BMI graph shows up.
- The third date range does not show any BMI graph at all, since it contains no height measurement (the date range is selected to be between the two first height measurements).
We understand how this behavior can be confusing and we hope to generate some discussion in the forum around how we can improve on the user experience.
Thanks again for bringing this to our attention. We look forward to your suggestions.
Support Team