Hi, Brian!
You can have as many user-defined graphs as you want, by using HealthFrame's customization feature (please look for the ellipsis - ... - button on the label line on the user defined graph page).
The basic idea is that you create a customization, and then save it (give it a name). You can then reuse it however many times you want.
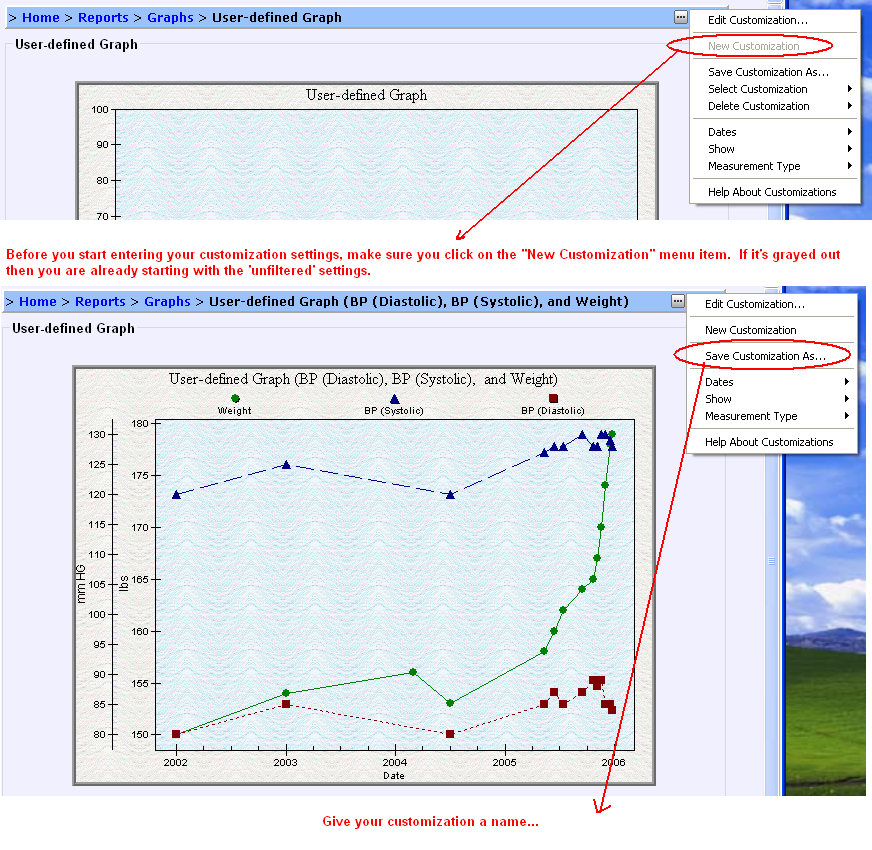
Here are the details (see image below):
- Make sure you start with fresh settings by clicking on the ... / New Customization menu. (If it's grayed out, then you're already using the default, unfiltered settings).
- Configure your settings (e.g. desired date ranges, types of measurements being graphed, etc). The image below shows graphic display for all dates, overlaying weight and blood pressure results.
- When you are done, it's time to save you work by using the ... / Save Customization As... menu item. I named the customization I created in step 2, "Weight vs. BP".
- Repeat steps 1 through 3 as many times as you would like, each time creating a new customization for your user-defined graph.
- Whenever you want to use one of your defined graphs, just select it from .../Select Customization/<Name of Customization>. Also, note that HealthFrame shows your customized user-defined graph on the list of graphs (Home > Reports > Graphs), as if if were built into HealthFrame.
![Smile [:)]](/emoticons/emotion-1.gif)
- If you want to change a customization, first select it (as in step 5), make your changes and repeat step 3, but instead of adding a new name, select the existing name from the drop down list.
Thanks for using HealthFrame and let us know if we can help you further!
Support Team