Records For Living Community

Share Information about HealthFrame and taking control of your own healthcare
Welcome to Records For Living Community Sign in | Join | Help
in Search

Weight graph

Last post 07-07-2008, 1:06 PM by Records For Living Support. 3 replies.
Sort Posts: Previous Next
  •  06-10-2008, 11:40 AM 1154

    Weight graph

    I have Health Frame Family edition version 2.1.6.  I have entered two recent body weights but only one shows up on the chart.  Hovering over the one and only blip does give me a date and weight of one of them and also values projected into the future but not the second weighing.

    Is it supposed to work this way or am I doing something wrong?

  •  06-12-2008, 9:02 PM 1156 in reply to 1154

    Re: Weight graph

    Attachment: TwoWeights.PNG
    Hi, Cool Swede!

    Welcome to the HealthFrame User Community Forum!  Smile [:)]

    I have tried to replicate the problem you describe and I created a brand new PHR with only two data points for weight measurements.  The image below shows what the Tests page looks like and the default weight graph that is generated by HealthFrame.  As you can see, both data points are being displayed.

    Since I am not sure what is different about your configuration, let me suggest that you "export" the graph data to the clipboard and then paste it to notepad (also shown in the image below).  Please take a look at the exported data and verify that:

    • The date and weight measurement values look reasonable to you; and
    • You have no configurations set which might be selecting a subset of date ranges.

    Thanks,
    Support Team
  •  07-02-2008, 8:57 AM 1171 in reply to 1156

    Re: Weight graph

    My chart started with my birth weight and the four weight measurements I took this last month.  All the recent ones are all bunched together and can't be read individually.  I then removed my birth weight and the time scale was more useful but I still wish that hovering over the time line would not show anything but my actual measurements.
  •  07-07-2008, 1:06 PM 1174 in reply to 1171

    Re: Weight graph

    Attachment: FilteringWeights.PNG
    Hi, Cool Swede!

    With HealthFrame, you can customize your reports and graphs so that you can see your data in a bunch of different ways, simply by configuring your filters.  You can have multiple customizations so that you can view your reports and graphs to display the information you need, when you need it - without having to re-enter the data or delete it.

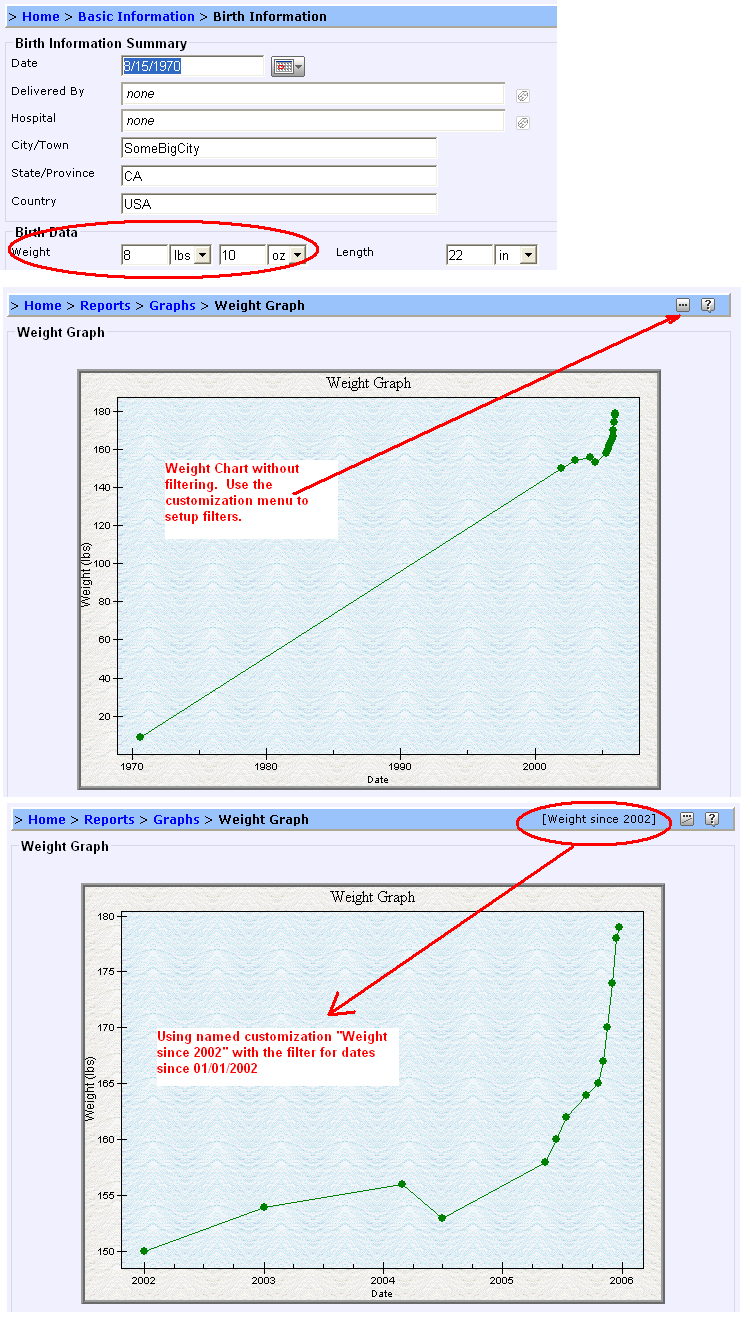
    Please take a look at the sample file for Susan Marie Taylor.  Her sample PHR contains her birth weight.  If we show the weight chart for her with no customizations, it shows up 'bunched together' as you said.  But if you create a customization, the data now shows up using a time scale that is more useful to you. 

    Try to re-enter your birth weight, and then try to create a customization (using the instructions in the link above).  Does your data "look" better now? 

    Also, the data that you should be seeing when you hover over the data points on the graph should be your weight and the date/time for measurements.  If that display bothers you, you can also customize it so that you don't see any 'hover' text.

    Please let us know if we can be of additional assistance!

    Support Team

View as RSS news feed in XML
Powered by Community Server, by Telligent Systems